[MUSAI] “GET READY FOR 2021”, Statistics Based Analysis of the Korean Localization Market Part 2. The Recording Industry
2020-11-20
In the previous article, we discussed the Korean translation business based on the official statistical data provided by the Korean Statistical Information Service. As promised, we will continue to look deep into the Korean localization market, focusing on the recording industry this time around.
The statistics in this article are based on companies registered as “Audio Recording Services”. Therefore, statistics from the cases below have been omitted from this article.
▶ Companies providing recording services that are not registered as “Audio Recording Services”
▶ Recording businesses run by individuals and/or are unincorporated.
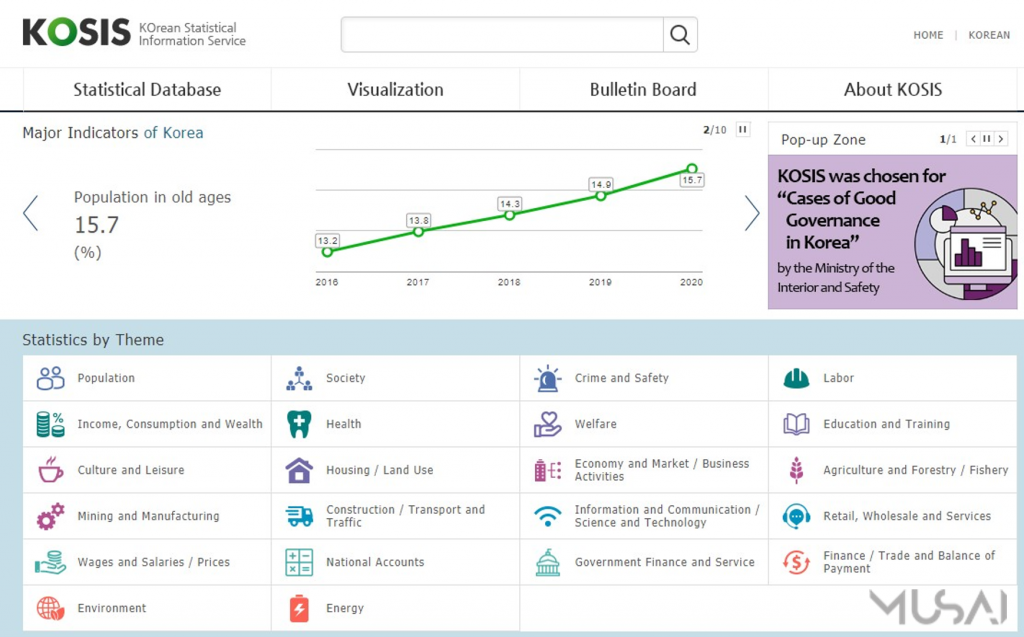
Additionally, we would like to inform you that the statistics presented in this article are based on accumulated data from 2018. The source of the statistics can be found in the link below.
http://kosis.kr/statHtml/statHtml.do?orgId=101&tblId=DT_1KB9003&conn_path=I3
The current state of the Korean recording business
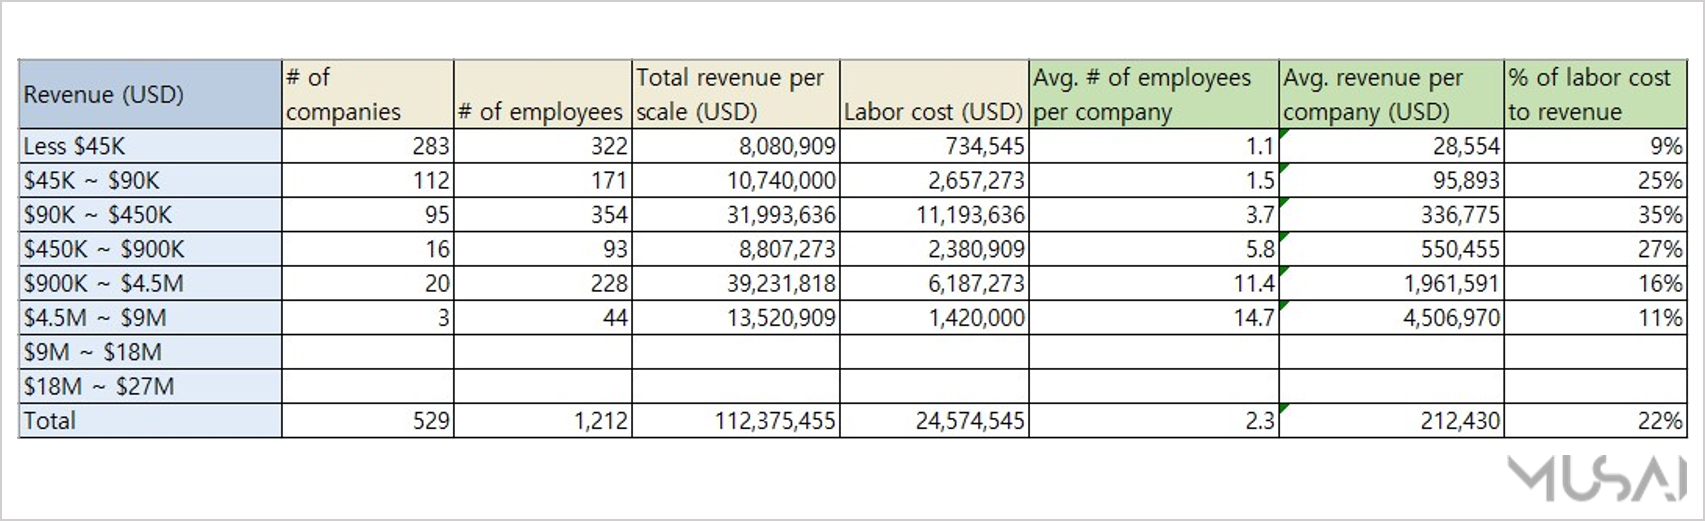
The total revenue of the Korean recording business amounts to roughly 113 million dollars. Out of the 529 companies, 86% of them are located in Seoul and other nearby cities.
Four interesting topics chosen by Musai
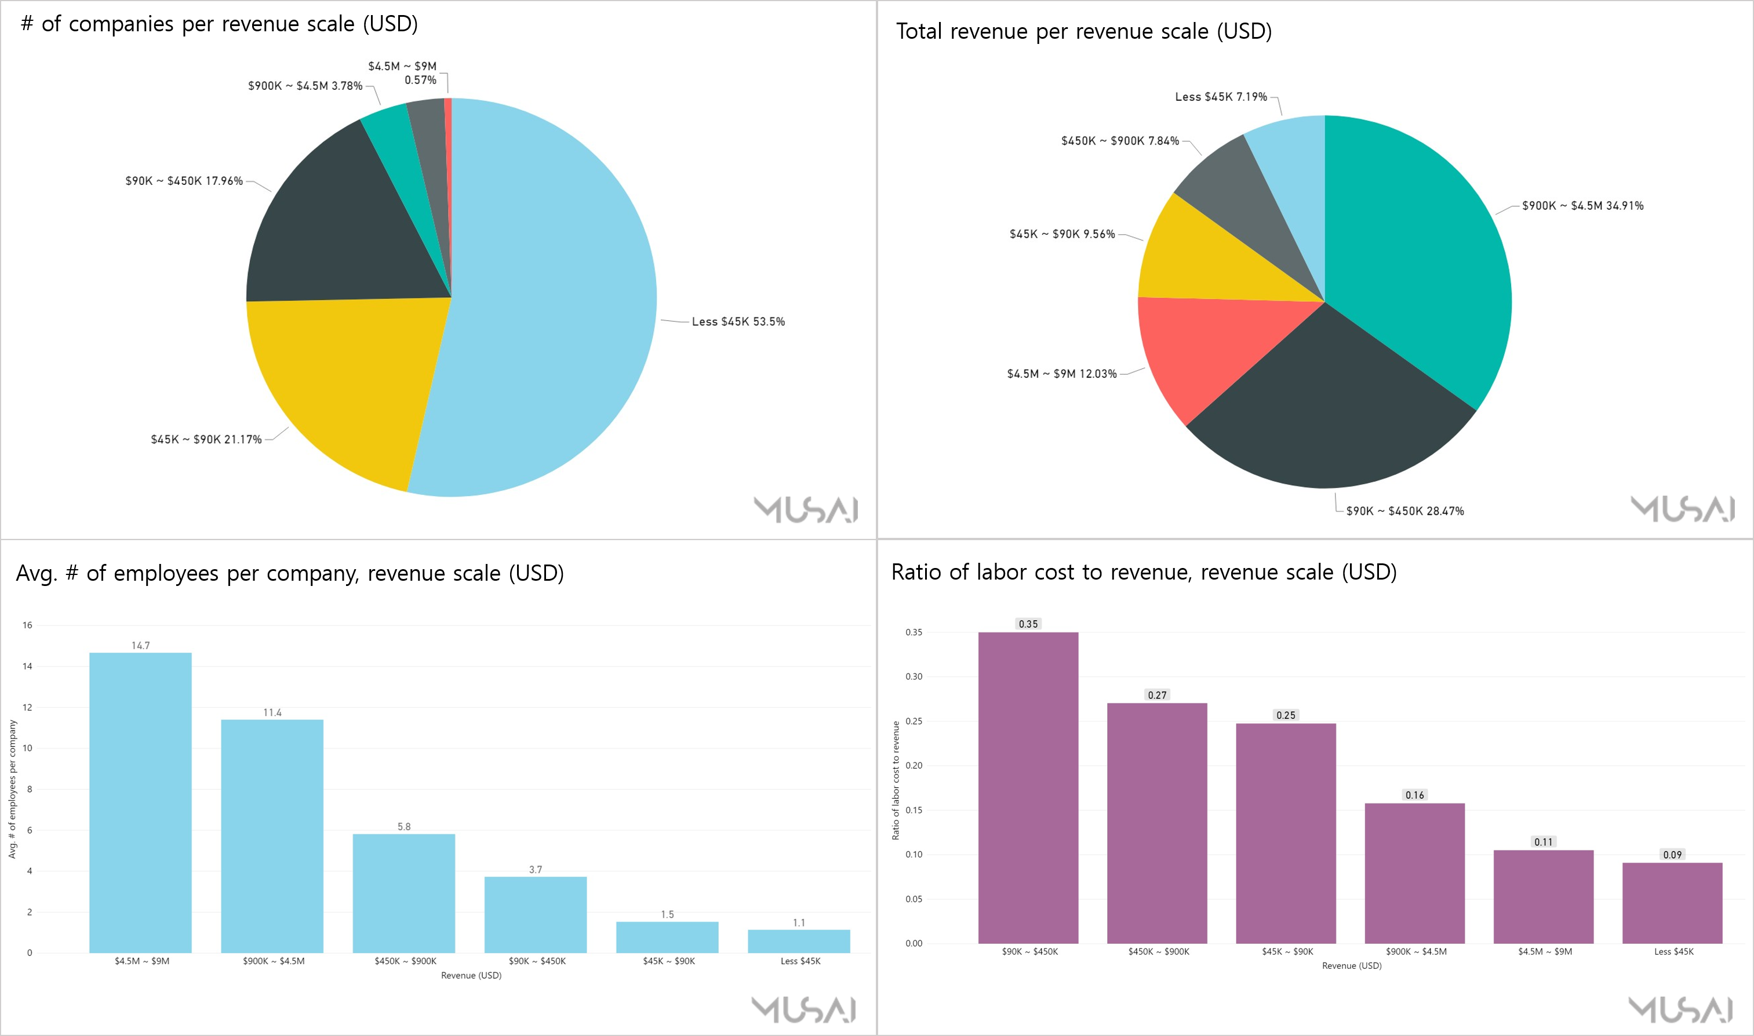
Musai Studio picked four topics and transformed the numbers of each statistic into diagrams to discuss in more detail. The charts below show 1) the number of companies per scale, 2) total revenue per scale, 3) average number of employees per company, 4) ratio of labor cost to revenue.
Summary
- 86% of the Korean recording business are located in Seoul and other main cities near Seoul.
- The largest number of recording companies lay within the range of an annual revenue of less than 45k dollars.
- Companies with an annual revenue of between 900k and 4.5 million dollars made up the greatest portion in total annual revenue of the Korean recording business.
- The average number of employees per company is 2 and the average annual revenue per company is about 200k dollars. The average ratio of labor cost to revenue is 22%.
[Part 1. The number of companies] How many recording companies are in Korea? Let’s figure it out by each revenue scale!
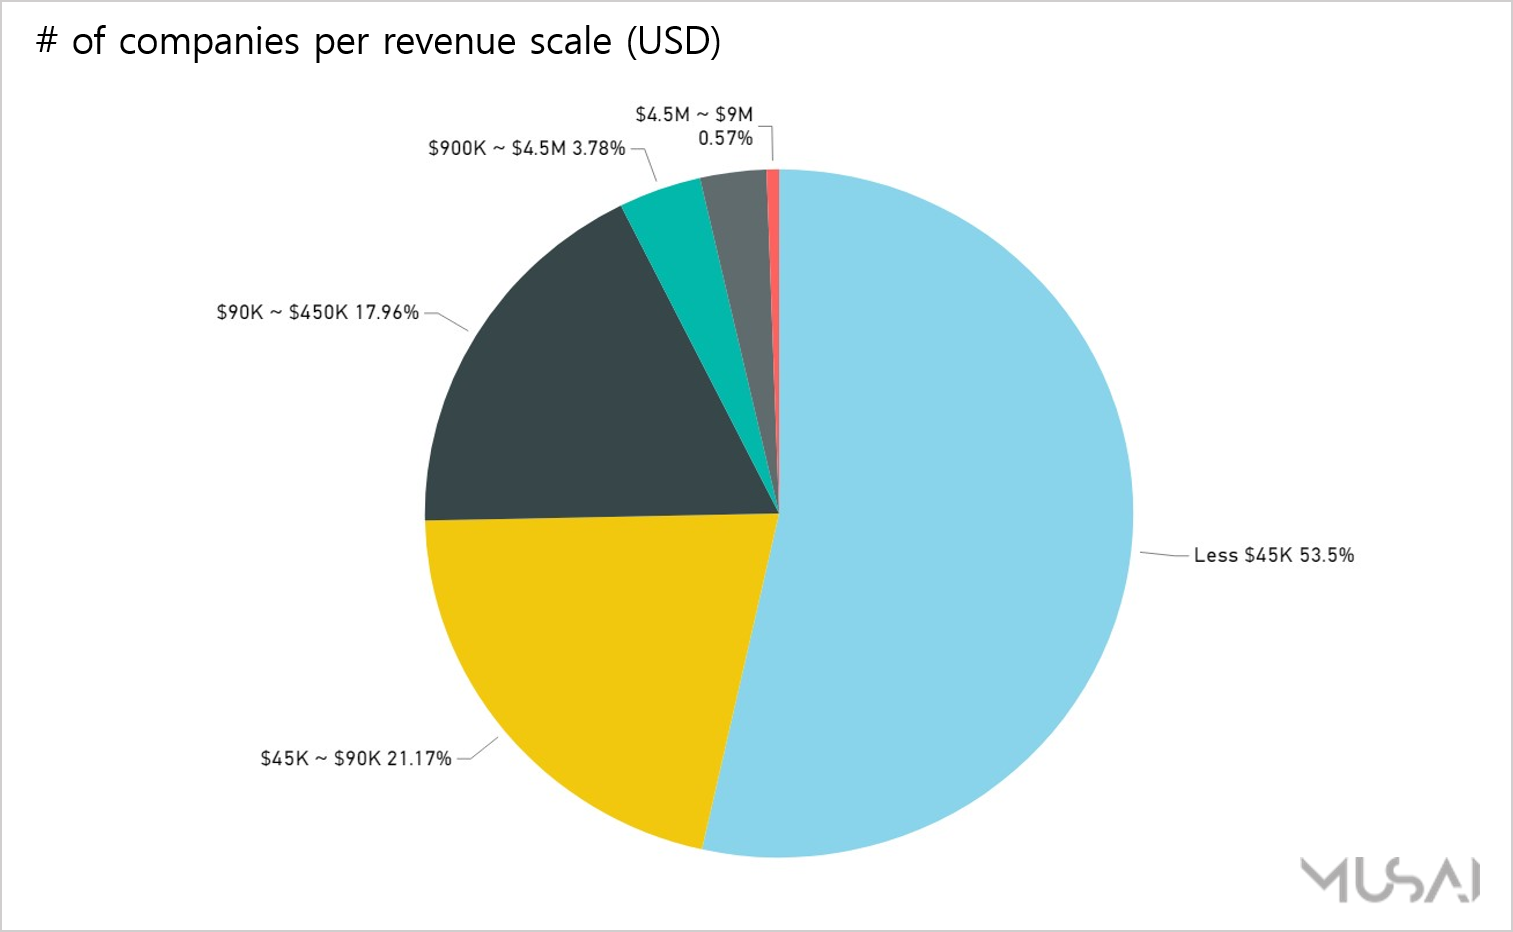
There are 283 companies with an annual revenue of less than 45k dollars and make up roughly 53% of the number of recording studios in Korea. Including them, companies under 90k dollars of revenue account for 77% of the total number of Korean recording studios so it’s fair to say that most recording businesses in Korea run small in size. In fact, we can assume that over half of them operate their business by using a rental recording studio since it’s barely enough to maintain their own studio and equipment with less than 45k dollars of an annual revenue.
Unfortunately, there are only 3 companies with an annual revenue of between 4.5 and 9 million dollars and none of the large size companies over 9 million dollars exist in Korea. This data shows the difficulties of recording business in Korea in terms of financial status currently.
[Part 2. The portion of the total revenue] Which scale of recording companies are taking the biggest portion of the total revenue in Korea?
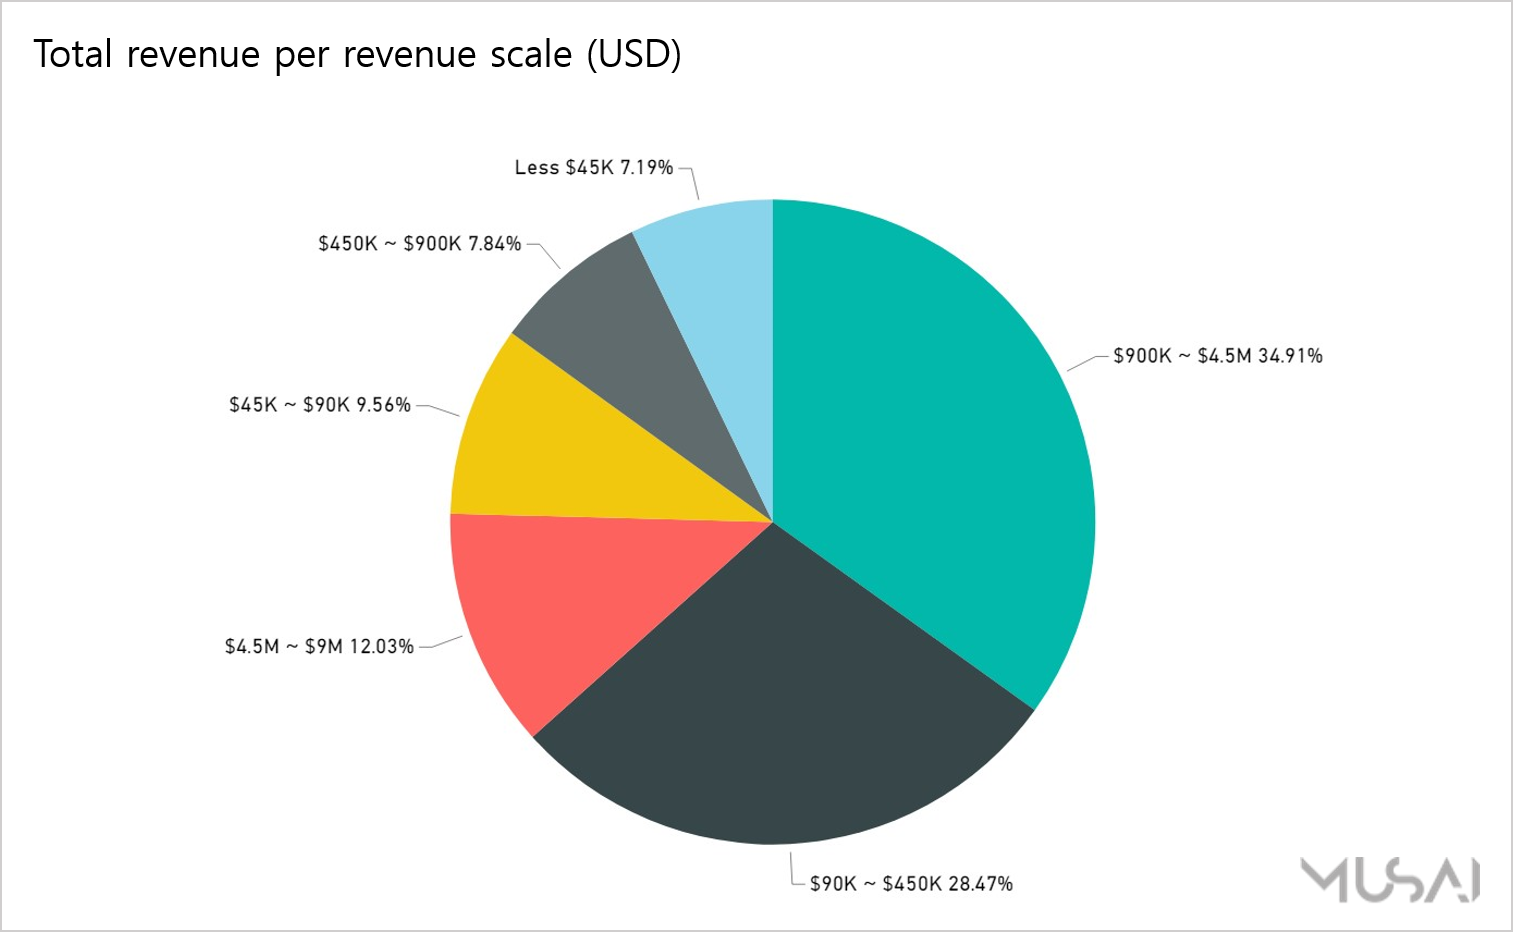
Companies with an annual revenue of between 900k and 4.5 million dollars, which account for only 4% of the total number of recording companies in Korea, made up the largest portion of the pie at 35% of the total revenue.
Meanwhile, companies with an annual revenue of less than 45k dollars, which are the most in terms of the number of the recording companies in Korea, account for 7% of the total annual revenue.
[Part 3. The average number of employees per company] What is the relation between the revenue and the number of employees in the recording business?
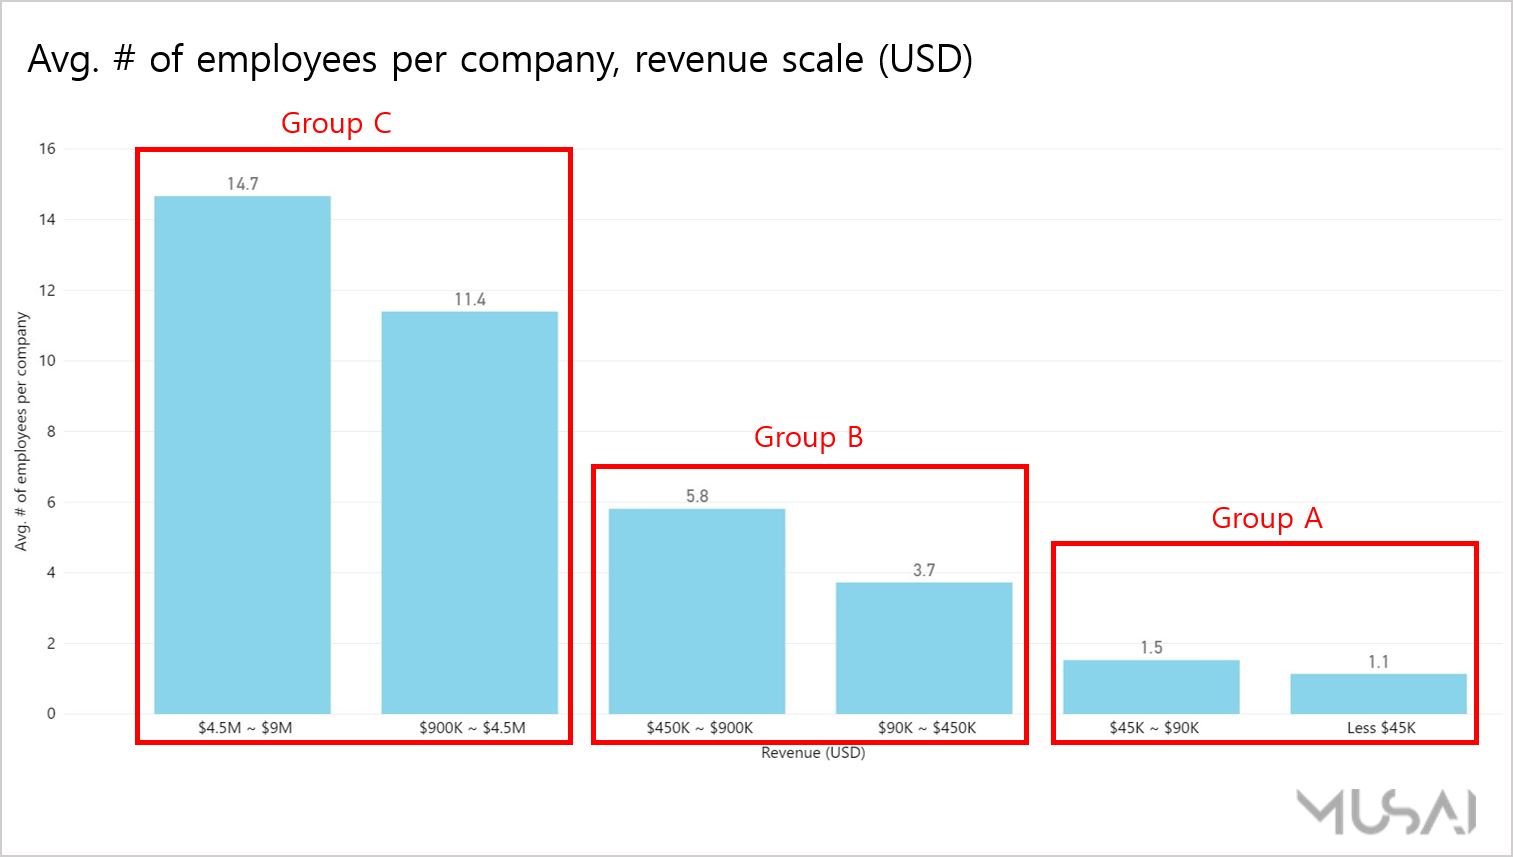
In terms of the average number of employees per company, both the translation and recording industries look similar. To be specific, companies in the revenue range of ‘Group A’ have less than 2 employees, which means many ‘one-man band’ type of businesses are dealing with all the processes by themselves. It’s likely that those types of businesses are run in a manner that a director conducts a recording session in a rental studio and hires a freelance engineer whenever he/she needs.
As for ‘Group B’, the numbers of employees don’t have a big difference as much as the gap in the two revenue ranges. It’s hard to point out one reason but it seems to reflect the fact that an increase of employment simply doesn’t’ lead to an increase of revenue in the recording industry. Meanwhile, the genre of contents or the number of recording facilities which means the booth with recording equipment and its capacity affect more on the revenue.
To be specific regarding the capacity of the recording booth, the revenue can be different depending on how many times the booth is operated even with the same number of employees. For example, the revenue will be different from the 4 hours recording session and over 6 hours recording session with one recording booth. However, you don’t need to hire more people for longer recording sessions, if efficient scheduling and planning is in place. Besides, with the same number of booths, the revenue can be different depending on the genre of the contents such as animations, games, commercials, etc. because the cost and metrics of recording each genre is set differently.
When companies need to expand the number of recording booths, recruiting is finally considered. That’s why the average number of employees per company in ‘Group C‘ is significantly higher than other groups. The increase of recording facilities means long-term investment based on the financial stability and it’s not easy to be decided since there are many factors to be considered such as available space for equipment as well as the financial status. Recruitment will be considered afterward accordingly.
[Part 4. The ratio of labor cost to revenue] What is the reason the ratio of labor cost to revenue in the recording business is low?

You can see that the ratio of labor cost to revenue for recording companies is quite low overall.
Firstly, the ratio of labor cost to revenue of the companies under 4.5k dollars revenue is less than 10%. As mentioned earlier, most of them run their business in a manner as a ‘one-man band’ without owning the recording studio. Therefore, since most of process is dealt with by the business owner or outsourced, the ratio of labor cost to revenue is low.
In addition, the ratio of labor cost doesn’t exceed 30% range. The ratio of labor cost goes up by 35% in the revenue range of between 90k and 450k dollars and drops down by 10% again in the range of over 450k dollars. The ratio of labor cost is quite lower compared to the translation industry and the reason can be assumed that the maintenance expenses for the recording business including costs for recording facilities and voice talents made up the large portion, the ratio of labor cost is relatively low.
Epilogue
If you’ve kept up with news published by the global localization media, you would notice that it was comprised of research and data about the main localization languages or rising markets such as China and India for the most part. Meanwhile, detailed information and research about the Korean localization market barely exists due to the scanty amount of supportive data compared to the interest and requests from overseas clients.
The article series “Statistics Based Analysis of the Korean Localization Market” that Musai has published relies on the data provided by Statistics Korea, so it’s difficult to say that the analysis represents the entire status of Korea. There may be inaccuracies that we may have missed, or additional data that was not accounted for. However, it’s obvious the need for data and research will increase enormously according to the expansion of the Korean localization market and the demands from the global market. We hope our efforts have triggered an interest in the Korean localization market.
** Did you enjoy our article? Please click subscribe and share the story.
BOOST YOUR PLAY! Musai Studio