[MUSAI] “GET READY FOR 2021”, Statistics Based Analysis of the Korean Localization Market Part 1. Translation Business
2020-11-12
November. The time of the year when people are usually associated with year-end events such as Thanksgiving and Christmas. However, for businesses, this is the season for preparing reports and proposals to forecast and plan the upcoming year. Luckily, Musai Studio has come up with a plan to share vital insight and statistical data for those who require information about the booming Korean localization industry.
It’s actually quite difficult to find data and research associated with the Korean localization market as compared to other industries, since much of this information exists only as estimations. Therefore, we will analyze the Korean translation business based on the data announced by the Korean National Statistical Office in this first article of the series.
![[Photo 1] The Korean Statistical Information Service website (Source: KOSIS.kr)](http://blog.musaistudio.com/wp-content/uploads/2020/11/1-KOSIS-1024x637.png)
Prologue
Before diving in, we would like to inform you that the statistics in this article are solely based on companies registered as “Translation and Interpretation services”. Therefore, statistics from the cases below have been omitted from this article.
▶ Companies providing translation services that are not registered as “Translation and Interpretation services”
▶ Translation businesses run by individuals and/or are unincorporated.
If we were to include the cases above, the actual number of translation businesses would be roughly twice the size of the current statistics. For example, statistics show that there are a total of 674 companies in this domain, but in actual practice, we can estimate roughly a thousand businesses. Furthermore, we would like to remind you that the statistics presented in this article are based on accumulated data from 2018. The source of the statistics can be found in the link here: http://kosis.kr/statHtml/statHtml.do?orgId=101&tblId=DT_1KB9003&conn_path=I3
The current state of the Korean translation business
![[Chart 1] The current state of the Korean translation business (Source: KOSIS)](http://blog.musaistudio.com/wp-content/uploads/2020/11/1-current-state-of-Korean-translation-business-1.png)
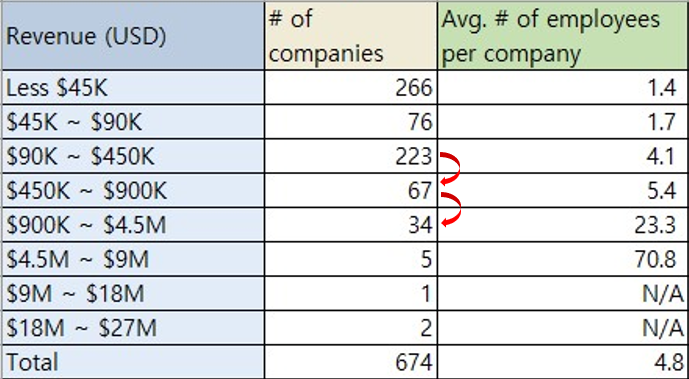
The total revenue of the Korean translation business amounts to roughly 250 million dollars. Out of the 674 companies, 77% of them are located in Seoul and other main cities near Seoul. The actual revenue and number of employees are undisclosed for companies that exceed 9 million dollars in revenue.
Four interesting topics chosen by Musai
Musai Studio picked four meaningful topics and transformed the numbers of each statistic into diagrams to provide visual feedback and discuss in more detail. The charts below show 1) the number of companies per scale, 2) total revenue per scale, 3) average number of employees per company, 4) ratio of labor cost to revenue.
![[Chart 2] 1) number of companies, 2) total revenue 3) average number of employees per company, 4) ratio of labor cost to revenue by each revenue scale (Source: Musai Studio)](http://blog.musaistudio.com/wp-content/uploads/2020/11/2-entire-chart.png)
Summary
- 77% of the total Korean translation business is located in Seoul and capital area.
- The largest number of translation companies lay within the range of an annual revenue of less than 45k dollars.
- Companies with an annual revenue of between 900k and 4.5 million dollars made up the greatest portion in total annual revenue of the Korean translation business.
- The average number of employees per company is 5 and the average annual revenue per company is 360k dollars. The average ratio of labor cost to revenue is 35%.
[Part 1. The number of companies] How many translation companies are in Korea? Let’s figure it out by each revenue scale!
![[Chart 3] The number of companies by each revenue scale (Source: Musai Studio)](http://blog.musaistudio.com/wp-content/uploads/2020/11/Part-1.png)
Companies with an annual revenue of less than 45k dollars are the most in terms of the number of translation companies. If we look at companies under 45k dollars of revenue, the average number of employees is 1.4 people. It’s possible to presume that the emergence and closure of new translation companies frequently happened in this revenue scale.
On the other hand, according to the statistics, there are 3 companies over 9 million dollars of revenue. The details of those companies are not shown in the data, so it is possible that they are branches of foreign translation companies (MLVs).
[Part 2. The portion of the total revenue] Which scale of translation companies are taking the biggest portion of the total revenue in Korea?
![[Chart 4] Total revenue by each revenue scale (Source: Musai Studio)](http://blog.musaistudio.com/wp-content/uploads/2020/11/chart-2.png)
Companies with an annual revenue of between 900k and 4.5 million dollars, which account for only 5% of the total number of translation companies in Korea, made up the largest portion of the pie at 36% of the total annual revenue. With this revenue scale, it can be assumed that these companies are in a period of financial stability with regular clients. In fact, they are the most active companies in marketing and sales.
Meanwhile, companies with annual revenue of less than 45k dollars, which are the most in terms of the number of the translation companies in Korea, only account for 3% of the total annual revenue.
[Part 3. The average number of employees per company] 10 employees, the highest wall in the Korean translation business
![[Chart 5] The average number of employees per company by each revenue scale (Source: Musai Studio)](http://blog.musaistudio.com/wp-content/uploads/2020/11/chart-3.png)
As expected, the higher the revenue, the higher the number of employees within an organization. Interestingly, companies with up to 90k dollars of revenue only have less than 2 employees on average, which means they are a so-called ‘one-man vendor’ dealing with all translation processes by oneself like ‘one-man band’.
Additionally, we can see a large gap between the ‘450k and 900k dollars’ range and the ‘900k and 4.5 million dollars’ range in terms of the number of employees per company.
 If we go back to the previous chart [Chart 3] and focus on the numbers of companies, there are many companies under 450k dollars of annual revenue but the number sharply decrease when it comes to the revenue scale of over 450k dollars. This number than decreases when it comes to the 900k+ dollars range similarly.
Based on these statistics, we can see that there are many cases to fail in expansion of the business without ensuring regular clients and good resources before entering the stable status in terms of business operation. Furthermore, when people who are aware of those difficulties within the localization industry start a business or become management levels, they make a plan to run a small size business strategically to avoid the risk associated with expansion.
[Part 4. The ratio of labor cost to revenue] What percentage the labor cost will be in total revenue?
![[Chart 6] The ratio of labor cost to revenue by each revenue scale (Source: Musai Studio)](http://blog.musaistudio.com/wp-content/uploads/2020/11/chart-4.png)
Based on the data above, it’s possible to calculate the percentage of outsourcing expenses. Companies with a revenue of less than 90k dollars have only a few employees so the ratio of labor cost to revenue is under 30%. With a small number of internal employees, companies tend to outsource most of the draft translations, increasing the expense of outsourcing accordingly.
On the other hand, the ratio of labor cost to revenue goes up to 52% as the revenue gets higher and the reasons can be assumed as follows:
- The increase of administration members: the bigger the company, the more people in administration such as sales, marketing, accounting, etc. are needed beyond the employees required for production.
- The subdivision of work process: as the work process is broken down into finer segments, regular employees such as project managers, engineers, and testers, etc. are needed.
- Specialized field: hiring regular employees for project specific services dealing with specialized areas such as law, patents, medicine, etc.
Localization is an inevitable process for products and services targeted to the global market. With statistics we can analyze and evaluate the Korean market, with the hopes of creating transparency in the industry to welcome a global audience and reduce any risks associated with uncertainty. We hope this article satisfies the thirst of those in search of data with regards to the Korean localization market. We will be back with the much sought-after analysis of the Korean recording industry in the next article of this series.
** Did you enjoy our article? Please click subscribe and share the story.
BOOST YOUR PLAY! Musai Studio